Estimating the sample mean and standard deviation (SD) from the five-number summary
-- maintained by Tiejun Tong
Step 1: Identify the appropriate scenario for the given summary data (for example, select Scenario 1 if the reported five-number summary includes the sample minimum, median, and maximum).
Step 2: Input the sample size and the five-number summary into the corresponding entries of each scenario (for example, enter Size = 100, Minimum = 11, Median = 18, and Maximum = 29).
Step 3: Click the 'Detect the skewness' button to test whether the data show significant skewness from normality, according to Shi et al. (2023).
Step 4: If the data are NOT significantly skewed (otherwise, move to Step 5), click the 'Calculate' button to obtain the sample mean and SD estimates using the optimal methods from Wan et al. (2014), Luo et al. (2018), and Shi et al. (2020).
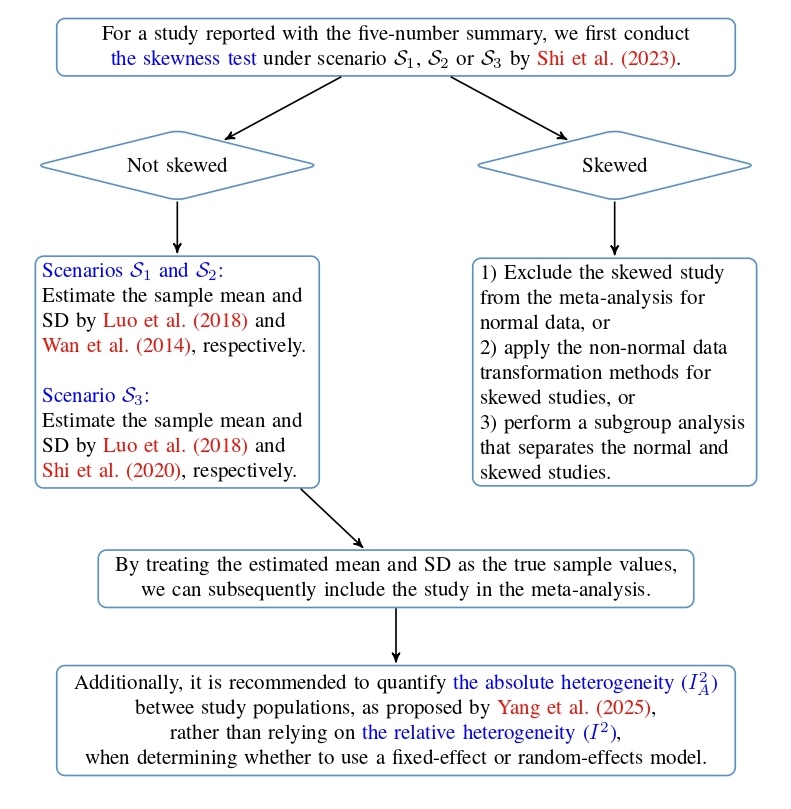
Step 5: If the data are significantly skewed, we recommend using the proposed flow chart to guide your analysis. The flow chart also introduces a new measure for quantifying heterogeneity in meta-analysis (Yang et al., 2025).
Scenario 1
Scenario 2
Scenario 3
References:
J. Shi, D. Luo, X. Wan, Y. Liu, J. Liu, Z. Bian and T. Tong (2023), "Detecting the skewness of data from the five-number summary and its application in meta-analysis", Statistical Methods in Medical Research, 32: 1338-1360.
J. Shi, D. Luo, H. Weng, X. Zeng, L. Lin, H. Chu and T. Tong (2020), "Optimally estimating the sample standard deviation from the five-number summary", Research Synthesis Methods, 11: 641-654.
D. Luo, X. Wan, J. Liu and T. Tong (2018), "Optimally estimating the sample mean from the sample size, median, mid-range and/or mid-quartile range", Statistical Methods in Medical Research, 27: 1785-1805.
X. Wan, W. Wang, J. Liu and T. Tong (2014), "Estimating the sample mean and standard deviation from the sample size, median, range and/or interquartile range", BMC Medical Research Methodology, 14: 135.
A flow chart for meta-analysis when some studies are reported with the five-number summary
Computing the absolute measure of heterogeneity in meta-analysis
-- maintained by Tiejun Tong
This online calculator computes the new measure of heterogeneity, , for quantifying the heterogeneity at the study population level (Yang et al., 2025). It ranges from 0 to 1, with higher values indicating greater heterogeneity between the studies. Moreover, is not influenced by the study sample sizes, making it an absolute measure of heterogeneity between the studies.
In contrast, the well-known statistic (Higgins and Thompson, 2002; Higgins et al., 2003) measures the heterogeneity between the observed effect sizes and is therefore highly dependent on the study sample sizes. A major limitation of is that it increases rapidly toward 1 when the sample sizes become large, making it a relative measure of heterogeneity between the studies.
To facilitate implementation, we offer two Data Input options as follows, depending on whether the Q or statistic is already available. This online calculator accommodates both single-arm and two-arm studies and supports commonly used effect sizes for continuous outcomes, including the mean difference (MD) and the standardized mean difference (SMD).
Option 1: Aggregate-level input
or
Absolute measure of heterogeneity from Yang et al. (2025)
Option 2: Individual-level input
Absolute measure of heterogeneity from Yang et al. (2025)
References:
K. Yang, E. Lin, W. Xu, L. Zhu and T. Tong (2025), "An alternative measure for quantifying the heterogeneity in meta-analysis", Statistics in Medicine, 44: e70089.
J. P. Higgins, S. G. Thompson, J. J. Deeks and D. G. Altman (2003), "Measuring inconsistency in meta-analyses", British Medical Journal, 327: 557-560.
J. P. Higgins and S. G. Thompson (2002), "Quantifying heterogeneity in a meta-analysis", Statistics in Medicine, 21: 1539-1558.